
Market Insights
Zacks Equity Research
MP's Operating Losses Continue in Q2: Can It Revert to Profitability?
MP Materials Corp. MP reported an operating loss of $32 million in the second quarter of 2026 compared with the year-ago loss of $43.9 million. Despite the narrower loss, the company extended its streak of operating losses to 12 consecutive quarters, reflecting ongoing margin pressure as it continues transitioning toward higher-value separated rare earth products.
During the quarter, revenues surged 89% year over year, fueled by higher neodymium-praseodymium (NdPr oxide) and metal sales and stronger pricing. However, cost of sales climbed 43% due to higher sales volumes of NdPr oxide and metal. Selling, general and administrative expenses rose 28% due to increased personnel costs. Start-up costs surged to $14 million from $0.76 million in the year-ago quarter due to the ramp-up of start-up activities for magnet production and chlor-alkali facilities, and costs associated with initial production of magnets at Independence.
This cost escalation trend has been building as MP accelerated its shift toward separated rare earth production. These products carry higher per-unit costs than rare earth concentrates because of the additional processing involved. Key cost components include chemical reagents, labor, maintenance and other consumables. In 2024, the cost of sales nearly doubled year over year to $192.6 million. In 2025, the cost of sales remained elevated at $192.8 million.
Operating expenses also trended higher. SG&A expenses rose 5% in 2024 and surged a further 35% in 2025, driven by workforce expansion to support downstream growth initiatives. MP Materials thus reported an operating loss of $169 million in 2024 and $149.4 million in 2025.
Producing separated rare earth products and magnetic materials involves significantly higher costs than concentrate production due to additional processing requirements, chemical inputs, labor and maintenance. Cost of sales is thus expected to trend higher, reflecting increased sales of NdPr oxide and metal along with added costs associated with magnetic precursor products. Start-up costs are also likely to increase in the coming quarters.
At the same time, NdPr production volumes continue to rise as process optimization and ramp-up efforts progress. Higher output, increased sales volumes and the United States Department of War’s (DoW) Price Protection Agreement will offset some of the margin pressure.
How Are MP’s Peers Faring?
Energy Fuels UUUU reported an operating loss of $30.6 million in the second quarter of 2026 compared with a loss of $26.2 million in the year-ago quarter. Energy Fuels reported a 192% surge in its cost of sales. Total operating costs and expenses increased 83% year over year to $55.7 million in the second quarter of 2026. Energy Fuels has reported an adjusted operating loss in the last nine consecutive quarters.
USA Rare Earth Inc. USAR reported early-stage revenues of $5.8 million in the second quarter of 2026, generated entirely from its Less Common Metals acquisition completed in 2025. It has not yet begun meaningful revenue generation from magnet manufacturing or mineral production. Meanwhile, total operating expenses surged 408% year over year. Selling, general and administrative increased 424%, due to higher legal and consulting costs and increased headcount. Operating loss in the quarter was $46.3 million compared with $8.8 million in the year-ago quarter.
MP’s Price Performance, Valuation & Estimates
MP Materials’ shares have declined 32.1% in a year against the industry’s 36.3% growth.
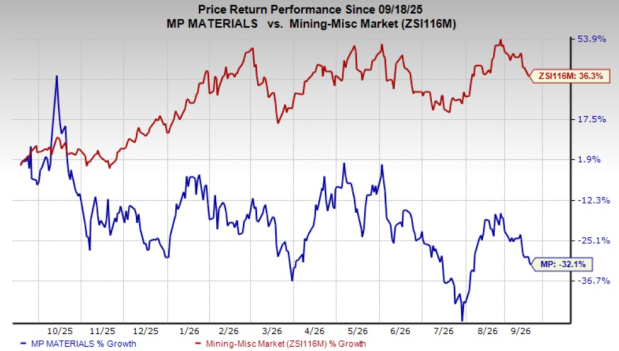
Image Source: Zacks Investment Research
MP is trading at a forward 12-month price/sales multiple of 12.77X, a significant premium to the industry’s 1.43X.
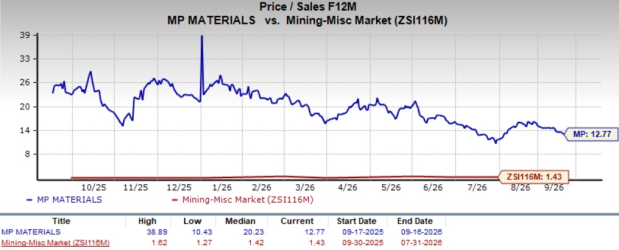
Image Source: Zacks Investment Research
The Zacks Consensus Estimate for MP Materials’ 2026 earnings is pegged at eight cents per share, indicating a solid improvement from the loss of 24 cents in 2025. The estimate for 2027 is 88 cents per share, indicating a 1,009% year-over-year improvement.
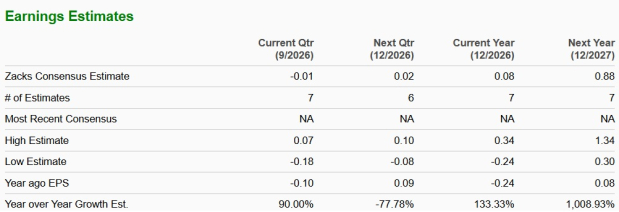
Image Source: Zacks Investment Research
The estimate for both years has moved down in the past 60 days.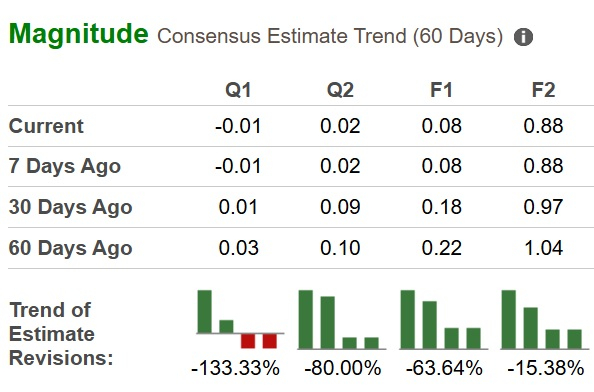
Image Source: Zacks Investment Research
The company currently carries a Zacks Rank #5 (Strong Sell).
You can see the complete list of today’s Zacks #1 Rank (Strong Buy) stocks here.
Beyond Nvidia: AI's Second Wave Is Here
The AI revolution has already minted millionaires. But the stocks everyone knows about aren't likely to keep delivering the biggest profits. AI’s second wave is moving from infrastructure to implementation and these companies are at the forefront of this transition, positioned to become what Amazon and Google were to the internet era.
See Stocks Now >>This article originally published on Zacks Investment Research (zacks.com).
MNST's International Sales Surge 35%: Is Global Expansion Paying Off?
Monster Beverage Corporation’s MNST international business is emerging as a major growth engine, supported by healthy energy-drink demand, product innovation and deeper execution with Coca-Cola bottling partners. The company continues to expand distribution, cooler placements and SKU availability across overseas markets while tailoring its portfolio to different consumer needs and price points. Growth has also benefited from the increasing popularity of zero-sugar offerings and affordable energy drinks, particularly across emerging markets. These initiatives are helping Monster Beverage strengthen its market presence and capture incremental consumption occasions outside the United States.
The momentum was evident in the second quarter of 2026, when net sales to customers outside the United States surged 34.6% to $1.16 billion, representing about 46% of total sales, compared with roughly 41% a year earlier. On a foreign currency-adjusted basis, international sales increased 29%. EMEA sales climbed 27.2%, while Asia-Pacific revenues advanced 35.7%. Latin America, including Mexico and the Caribbean, recorded a 56.1% increase. Among key markets, China sales jumped 62.5%, India rose 84% and Brazil advanced 82%.
Several strategic initiatives suggest that Monster Beverage is building a broader foundation for international growth rather than relying solely on category expansion. In EMEA, the company is increasing branded cooler placements, expanding energy zones with retailers and rolling out additional Monster Ultra and Juice Monster offerings. In Asia, management remains focused on expanding affordable brands and opening new markets, while collaboration with Coca-Cola bottlers is improving availability and execution. These efforts, combined with innovation across Monster, Bang and other brands, are helping the company reach consumers across different income levels, occasions and preferences.
Still, rapid international expansion brings a margin consideration. Management noted that overseas markets generally carry lower gross-margin percentages than the U.S. business, meaning a rising international sales mix can weigh on the company’s consolidated margin rate even while adding profit dollars. Monster Beverage is also navigating inflation in aluminum, freight and fuel, while selectively pursuing pricing actions across markets. Therefore, the key issue is whether continued overseas volume growth, market-share gains and pricing can offset these cost and mix pressures while sustaining the strong contribution from international operations.
MNST’s Zacks Rank & Share Price Performance
Shares of this Zacks Rank #3 (Hold) company have appreciated 38% in the past year, outperforming the Zacks Beverages - Soft Drinks industry and the broader Consumer Staples sector’s rise of 22% and 4.6%, respectively.
MNST Stock's One-Year Performance
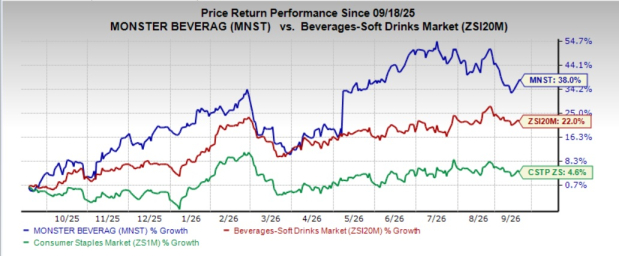
Image Source: Zacks Investment Research
Is MNST a Value Play Stock?
Monster Beverage’s shares are currently trading at a forward 12-month price-to-earnings (P/E) multiple of 36.59X, significantly above the industry’s average of 19.32X.
MNST P/E Ratio (Forward 12 Months)
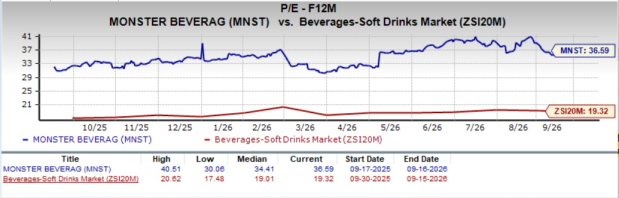
Image Source: Zacks Investment Research
Stocks to Consider
Vita Coco Company COCO is a global beverage company best known for its Vita Coco coconut water brand, with a diversified portfolio spanning coconut-based products, plant-based alternatives, functional drinks and private-label offerings across retail, e-commerce and foodservice channels. COCO currently flaunts a Zacks Rank #1 (Strong Buy). You can see the complete list of today’s Zacks #1 Rank stocks here.
The Zacks Consensus Estimate for Vita Coco’s 2026 sales and earnings indicates growth of 31.6% and 63.8%, respectively, from the year-ago reported numbers. The company delivered a trailing four-quarter earnings surprise of 21.9%, on average.
The Chefs' Warehouse, Inc. CHEF distributes specialty food and center-of-the-plate products in the United States, the Middle East and Canada. At present, CHEF flaunts a Zacks Rank #1.
The consensus estimate for Chefs' Warehouse’s current fiscal-year sales and earnings implies growth of 10.5% and 33.7%, respectively, from the year-ago reported figures. Chefs' Warehouse delivered a trailing four-quarter earnings surprise of 30.4%, on average.
Medifast, Inc. MED, which is a leading manufacturer and distributor of clinically proven healthy living products and programs, currently carries a Zacks Rank #2 (Buy). MED missed the average earnings surprise by a sharp margin in the trailing four quarters.
The Zacks Consensus Estimate for Medifast’s current financial-year sales indicates a decline of 27.3% from the year-ago number.
Beyond Nvidia: AI's Second Wave Is Here
The AI revolution has already minted millionaires. But the stocks everyone knows about aren't likely to keep delivering the biggest profits. AI’s second wave is moving from infrastructure to implementation and these companies are at the forefront of this transition, positioned to become what Amazon and Google were to the internet era.
See Stocks Now >>This article originally published on Zacks Investment Research (zacks.com).
Lennar Q3 Earnings Miss Estimates on Housing Weakness, Revenues Lag
Lennar Corporation LEN reported weaker-than-expected third-quarter fiscal 2026 (ended Aug. 31) results. The quarter’s adjusted earnings and total revenues missed the Zacks Consensus Estimate and declined year over year.
The ongoing softness in housing demand, resulting in lower deliveries and a weaker average sales price (ASP) for homes delivered, led to declining quarterly results.
LEN stock trickled down 2.1% during yesterday’s after-hours trading session, following the earnings announcement.
LEN’s Quarterly Numbers
Adjusted earnings of $1.23 per share missed the Zacks Consensus Estimate of $1.29 by 4.7% and fell 38.5% from $2.00 per share a year ago.
Total revenues of $8.05 billion missed the consensus estimate of $8.33 billion by 3.4% and declined 8.6% year over year. Lower deliveries and home prices weighed on results amid affordability pressure. Inventory turn stood at 2.4 times.
Lennar Corporation Price, Consensus and EPS Surprise

Lennar Corporation price-consensus-eps-surprise-chart | Lennar Corporation Quote
Lennar’s Homebuilding Highlights
Homebuilding revenues decreased 6% year over year to $7.76 billion from $8.25 billion. Revenues from home sales fell to $7.73 billion from $8.21 billion, reflecting weaker pricing and fewer closings.
Home deliveries declined 3.4% to 20,840 from 21,584 but remained within management's guidance of 20,500-21,500 homes. The ASP of homes delivered decreased 2.9% to $372,000 from $383,000. Management said pricing reflected about 12% in incentives, along with base-price adjustments aimed at sustaining volume.
New orders fell 9.2% year over year to 20,879 homes. Their dollar value decreased 11.1% to $7.5 billion from $8.44 billion, while the ASP of new orders declined to $359,000 from $367,000.
Backlog slipped 0.6% to 16,857 homes from 16,953. The backlog value declined 4.6% to $6.35 billion from $6.65 billion, while the average sales price in backlog fell to $376,000 from $392,000. Active communities increased to 1,713 from 1,664.
Gross margin on home sales contracted to 15.8% from 17.5% a year ago. Lower revenue per square foot and higher land costs contributed to the decline, partly offset by lower construction costs from ongoing cost-saving initiatives. Selling, general and administrative (SG&A) expenses rose to 9.2% of home sales from 8.2%, mainly because of lower revenue leverage and higher marketing and selling costs. Net margin on home sales was 6.6%. Construction cost per square foot improved 6% year over year, while cycle time fell to a record 116 days from 126 days.
Lennar's Financial Services & Other Segments Diverge
Financial Services revenues declined to $226.1 million from $314.2 million a year ago. Operating earnings decreased to $129 million from $177 million. The current quarter included $39 million of net one-time items, primarily tied to a litigation accrual reversal following a court judgment.
Multifamily revenues fell to $38.5 million from $228.5 million, while its operating loss narrowed to $3 million from $16 million.
Lennar Other revenues rose to $22 million from $13.9 million, but the segment posted an $84 million operating loss against $62 million of operating earnings a year ago, largely due to $53 million of mark-to-market losses on technology investments.
LEN's Balance Sheet Shows Higher Leverage
Homebuilding cash and cash equivalents totaled $1.15 billion at quarter-end. Lennar had $650 million of borrowings outstanding under its $3.1 billion revolving credit facility. Homebuilding debt to total capital was 16.6% compared with 13.5% a year earlier.
The company repurchased 3 million shares for $256 million at an average price of $85.49 and redeemed $400 million of 5.25% senior notes due June 2026. Of roughly 488,000 homesites owned and controlled, less than 2.5% were owned on the balance sheet.
Lennar's Q4 Outlook Reflects Continued Market Pressure
For the fourth quarter of fiscal 2026, Lennar expects new orders of 19,500-20,500 homes and deliveries of 22,000-23,000 homes. The ASP is projected between $370,000 and $380,000.
Gross margin on home sales is expected at 15.5-16%, while SG&A is projected at 8.7-9% of home sales. Financial Services operating earnings are forecast at $90-$95 million. Management reduced its full-year fiscal 2026 delivery target to about 80,000-81,000 homes from 82,000-83,000, citing continued interest-rate pressure and weaker market conditions.
LEN’s Zacks Rank & Stocks With the Favorable Combination
Lennar currently carries a Zacks Rank #5 (Strong Sell).
Here are some companies in the Zacks Construction sector, which per our model, have the right combination of elements to post an earnings beat in the respective quarters to be reported. The combination of a positive Earnings ESP and a Zacks Rank #1 (Strong Buy), 2 (Buy) or 3 (Hold) increases the odds of an earnings beat.
Quanta Services, Inc. PWR currently has an Earnings ESP of +3.66% and a Zacks Rank of 1 presently. You can see the complete list of today’s Zacks #1 Rank stocks here.
Quanta’s earnings have topped in each of the trailing four quarters, the average surprise being 17%. The company’s earnings for the third quarter of 2026 are expected to grow 46.9%.
Everus Construction Group, Inc. ECG currently has an Earnings ESP of +0.52% and a Zacks Rank of 1.
Everus’ earnings have topped in each of the trailing four quarters, the average surprise being 57%. The company’s earnings for the third quarter of 2026 are expected to grow 15.3%.
Comfort Systems USA, Inc. FIX currently has an Earnings ESP of +4.37% and a Zacks Rank of 2.
Comfort Systems’ earnings beat estimates in each of the last four quarters, the average surprise being 34.6%. The company’s earnings for the third quarter of 2026 are expected to grow 50.6%.
Beyond Nvidia: AI's Second Wave Is Here
The AI revolution has already minted millionaires. But the stocks everyone knows about aren't likely to keep delivering the biggest profits. AI’s second wave is moving from infrastructure to implementation and these companies are at the forefront of this transition, positioned to become what Amazon and Google were to the internet era.
See Stocks Now >>This article originally published on Zacks Investment Research (zacks.com).
Can LSCC's FPGA Portfolio Expansion With Mach-N2 Drive Growth?
Lattice Semiconductor Corporation LSCC has launched the new Mach-N2 FPGA family, offering secure control solutions for computing, communications and industrial infrastructure. Built on the company’s Nexus 2 small FPGA platform, the devices combine higher logic density, advanced connectivity and integrated security features to support modern, long-lifecycle systems.
Lattice’s Mach-N2 devices offer up to twice the logic density of previous solutions, supporting advanced system control functions. Enhanced SERDES bandwidth enables direct connections to modern system-on-chips and processors, while low-latency, deterministic performance supports real-time monitoring. They provide power sequencing and system management capabilities for infrastructure applications.
The company’s platform includes advanced security features and supports CNSA 2.0-compliant post-quantum cryptography, including ML-DSA, LMS, XMSS and ML-KEM. It also offers crypto-agility, PUF-based device identity, DICE and SPDM attestation to help protect systems and supply chains. Integrated non-volatile flash secures configuration data and instant-on configuration enables faster startup. Support for up to three configuration images provides flexibility for system recovery.
For high-speed connectivity, the new family supports PCIe 4.0, 10G Ethernet and SERDES speeds of up to 16 Gbps. The combination of performance, integrated flash and advanced security capabilities broadens Lattice’s offerings for trusted system control across next-generation infrastructure.
How Are Competitors Performing?
Lattice faces stiff competition from Ambarella, Inc. AMBA and FormFactor, Inc. FORM. Ambarella launched the X7 edge artificial intelligence (AI) accelerator, expanding its semiconductor portfolio for AI applications. The company is working with partners to bring AI models and management tools to its low-power edge AI chips. Ambarella is strengthening its focus on edge AI applications across automotive, robotics, industrial and security markets.
FormFactor expanded its semiconductor test and measurement capabilities to support advanced technologies such as AI, high-performance computing and advanced packaging. The company has partnered with Keystone Microtech to increase probe card manufacturing and testing capabilities. FormFactor is witnessing strong demand for its semiconductor test technologies, particularly from High Bandwidth Memory and AI-related applications.
LSCC’s Price Performance, Valuation & Estimates
Lattice shares have soared 58.8% over the past year compared with the industry’s 26.7% growth.
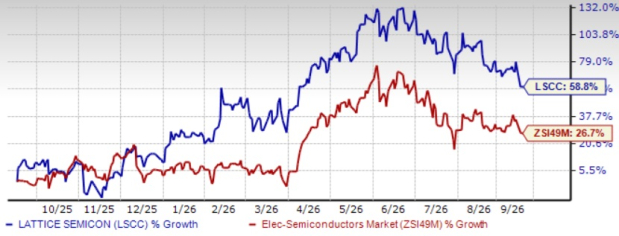
Image Source: Zacks Investment Research
From a valuation standpoint, Lattice trades at a forward price-to-sales ratio of 12.36, above the industry tally of 4.75.
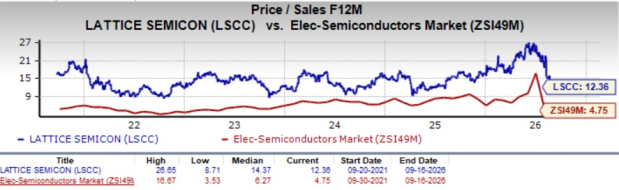
Image Source: Zacks Investment Research
Earnings estimates for 2026 have increased 19% to $2.13 per share over the past 60 days, while the same for 2027 have risen 34.5% to $3.08.
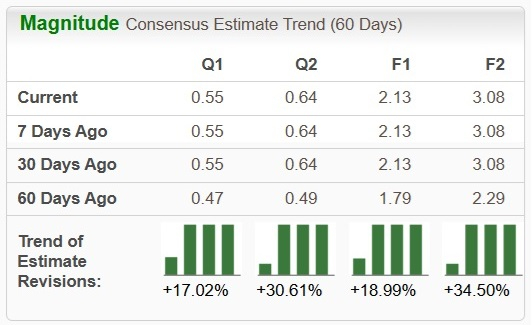
Image Source: Zacks Investment Research
Lattice currently carries a Zacks Rank #3 (Hold). You can see the complete list of today’s Zacks #1 Rank (Strong Buy) stocks here.
Beyond Nvidia: AI's Second Wave Is Here
The AI revolution has already minted millionaires. But the stocks everyone knows about aren't likely to keep delivering the biggest profits. AI’s second wave is moving from infrastructure to implementation and these companies are at the forefront of this transition, positioned to become what Amazon and Google were to the internet era.
See Stocks Now >>This article originally published on Zacks Investment Research (zacks.com).
Vitesse Energy Expands DJ Basin Footprint With $26M Deal
Vitesse Energy, Inc. VTS has completed an acquisition of non-operated oil and gas assets in Colorado’s Denver-Julesburg (DJ) Basin, adding production and further strengthening its position in a key U.S. oil and gas region. The transaction is expected to be immediately accretive to several per-share financial metrics while maintaining the company’s focus on disciplined, low-risk acquisitions.
Vitesse Energy Adds Chevron-Operated DJ Basin Assets
Vitesse Energy paid an initial unadjusted purchase price of $26 million for the assets, with customary purchase price adjustments still applicable. The cash consideration was funded through a combination of cash on hand and borrowings under Vitesse Energy’s revolving credit facility.
The acquired properties are located primarily in Weld County, CO, and are operated entirely by Chevron Corporation CVX. Vitesse Energy expects the assets to generate approximately 900 barrels of oil equivalent (BOE) per day over the next 12 months, with oil accounting for 28% of production on a two-stream basis.
The acquisition closed on Sept. 15, 2026, with an effective date of June 1, 2026.
Deal Expected to Boost Key Financial Metrics
The acquisition is expected to be immediately accretive on a per-share basis to earnings, operating cash flow, free cash flow and net asset value. This reflects Vitesse Energy’s strategy of targeting non-operated assets that can generate durable returns without requiring the company to directly operate the properties.
Vitesse Energy has also entered into commodity derivative contracts covering a significant portion of the acquired production through 2030. The hedges are designed to support the company’s underwritten returns and provide greater visibility into cash flows from the newly acquired assets.
Chevron’s DJ Basin Position Adds Strategic Appeal
The acquired assets benefit from being operated by Chevron, which has a substantial presence in Colorado’s DJ Basin. Chevron’s development program spans roughly 580,000 net acres and uses multi-well pads, horizontal drilling and hydraulic fracturing to develop its acreage efficiently.
Chevron’s Colorado operations averaged about 125,000 barrels per day of crude oil, 100,000 barrels per day of Natural Gas Liquids and 945 million cubic feet per day of natural gas in 2025. Management has indicated that DJ Basin production is around 400,000 BOE per day, highlighting the basin’s importance to Chevron’s U.S. unconventional portfolio.
Acquisition Fits VTS’ Disciplined Growth Strategy
The deal expands Vitesse Energy’s exposure to a mature U.S. oil-producing region while adding predominantly proved developed producing assets. According to management, the transaction aligns with the company’s disciplined acquisition strategy and is intended to deliver durable, low-risk returns to stockholders.
With production growth, expected per-share accretion and hedges extending through 2030, the acquisition gives Vitesse Energy an opportunity to strengthen cash-flow generation while limiting some commodity-price exposure on the acquired volumes.
VTS’ Zacks Rank & Key Picks
Vitesse Energy is an independent energy company engaged in the acquisition, development and production of non-operated oil and natural gas properties principally in the United States. Currently, VTS carries a Zacks Rank #5 (Strong Sell).
Investors interested in the energy sector may consider some top-ranked stocks like Forum Energy Technologies, Inc. FET and PBF Energy Inc. PBF, each sporting a Zacks Rank #1 (Strong Buy) at present. You can see the complete list of today’s Zacks #1 Rank stocks here.
Forum Energy Technologies is a global oilfield products company, serving the subsea, drilling, completion, production and infrastructure sectors of the oil and natural gas industry. The Zacks Consensus Estimate for FET’s 2026 earnings indicates 536.5% year-over-year growth.
PBF Energy is a leading independent crude oil refiner that produces unbranded transportation fuels, heating oil, petrochemical feedstocks, lubricants and other petroleum products. The Zacks Consensus Estimate for PBF’s 2026 earnings indicates 481.1% year-over-year growth.
Beyond Nvidia: AI's Second Wave Is Here
The AI revolution has already minted millionaires. But the stocks everyone knows about aren't likely to keep delivering the biggest profits. AI’s second wave is moving from infrastructure to implementation and these companies are at the forefront of this transition, positioned to become what Amazon and Google were to the internet era.
See Stocks Now >>This article originally published on Zacks Investment Research (zacks.com).
Can Coursera Convert 44% Subscriber Growth Into Bigger Profits Ahead?
Coursera, Inc. COUR is seeing strong momentum in its subscription business, with a sharp increase in paid subscribers providing a potentially important lever for improving profitability. However, sustaining this growth while managing pressure in transactional offerings remains key.
Coursera ended the second quarter of 2026 with more than 1.65 million paid subscribers, up 44% year over year. Consumer subscription revenues reached approximately $122 million, accounting for more than 75% of Consumer revenues. Management said core subscriptions remain the segment’s growth engine as the company shifts toward a subscription-first model. The improving subscription mix is also supporting margins. During the second quarter of 2026, consumer gross profit increased 37% year over year to $103.2 million, while segment gross margin expanded 380 basis points (bps) to 65.1%. Companywide adjusted gross margin climbed 620 bps to 62.2%, while adjusted EBITDA jumped 137% to $42.7 million, translating into a 14.3% margin.
COUR also raised its full-year 2026 adjusted EBITDA margin target to approximately 14%, up 100 bps from its June outlook. Fourth-quarter 2026 adjusted EBITDA margin is expected to exceed 16%, reflecting anticipated benefits from integration and synergy initiatives following the Udemy combination. Still, challenges remain. Consumer revenues declined 5% on a normalized basis, as subscription growth was offset by pressure in individual-program subscriptions and transactional offerings. Overall normalized revenues also declined 1%.
With recurring subscription streams now accounting for more than 85% of total revenues, Coursera's ability to sustain subscriber growth while converting its expanding recurring base into higher margins will be crucial to its profitability trajectory.
Coursera vs. Stride & Chegg: Who Has the Stronger User Base?
Coursera, alongside its market peers Stride, Inc. LRN and Chegg, Inc. CHGG, addresses different segments of the expanding online-learning market. Coursera offers courses, professional certificates, degrees and enterprise upskilling, and its combination with Udemy has created an ecosystem exceeding 300 million learners and 1.65 million paid subscribers. Paid subscribers rose 44% year over year in the second quarter of 2026, highlighting strong subscription traffic.
Meanwhile, Stride focuses on K-12 and career learning through virtual schools, curriculum, technology and support services. Its fiscal 2026 enrollments rose 4.2% to 243,900, with Career Learning enrollments increasing 13.9%. Chegg remains more concentrated in student learning and workforce skilling. However, the second quarter of 2026 revenues fell 51%, while Skilling revenues increased 2%, reflecting the ongoing shift toward employability-focused offerings.
COUR has a distinct scale and platform-breadth advantage, particularly following the Udemy combination, while its AI investments and growing subscription base align with rising demand for continuous skills development. However, its enterprise net retention rate was 91%, showing that corporate learning demand remains mixed.
COUR Stock’s Price Performance & Valuation Trend
Shares of this California-based online learning platform provider have declined 10.5% over the past six months, underperforming the Zacks Technology Services industry, the Zacks Business Services sector and the S&P 500 Index, as the trendlines highlight below.
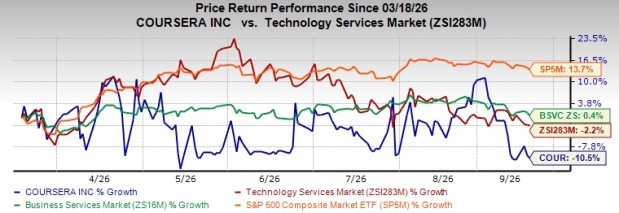
Image Source: Zacks Investment Research
COUR stock is currently trading at a discount compared with its industry peers, with a forward 12-month price-to-sales (P/S) ratio of 0.96, as the trend lines suggest below.
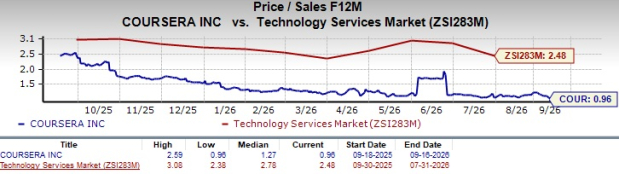
Image Source: Zacks Investment Research
Earnings Estimate Revision of COUR
COUR’s earnings estimates for 2026 and 2027 have moved north to 65 cents and 92 cents per share, respectively, over the past 60 days. The revised estimated figures for 2026 and 2027 imply year-over-year growth of 66.7% and 40.3%, respectively.
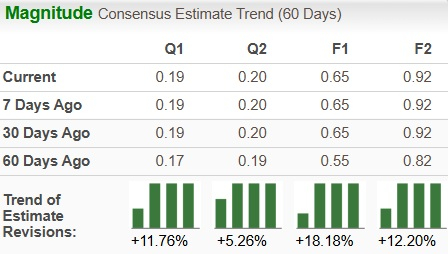
Image Source: Zacks Investment Research
Coursera currently carries a Zacks Rank #3 (Hold). You can see the complete list of today’s Zacks #1 Rank (Strong Buy) stocks here.
Beyond Nvidia: AI's Second Wave Is Here
The AI revolution has already minted millionaires. But the stocks everyone knows about aren't likely to keep delivering the biggest profits. AI’s second wave is moving from infrastructure to implementation and these companies are at the forefront of this transition, positioned to become what Amazon and Google were to the internet era.
See Stocks Now >>This article originally published on Zacks Investment Research (zacks.com).
Can INTC's AI Inference Advancements Strengthen Its Growth Prospects?
Intel Corporation INTC has advanced artificial intelligence (AI) inference capabilities with its latest MLPerf Inference v6.1 results, showing performance gains across Intel Xeon 6 processors and Intel Arc Pro B-series GPUs. The results highlight the company’s continued efforts to optimize AI frameworks, kernels and serving software for more efficient inference.
Intel Xeon 6980P processors delivered 2.4x higher Llama 3.1 8B Server throughput and 56% higher Offline throughput than MLPerf v6.0 using the same hardware setup, reflecting the benefits of software optimization. Its platforms recorded an increase in customer and partner results from 29 to 39, with Oracle, Red Hat, Quanta Cloud Technology and Supermicro making their first submissions.
The company expanded Xeon 6 participation from two to five processor models, increasing CPU inference results from 24 to 35. Its Arc Pro B70 GPUs supported workloads including Llama 2 70B, gpt-oss-120B and Whisper. A four-GPU system offers 128GB of Video Random Access Memory, with Server performance rising 36% and Offline performance increasing 27% compared with MLPerf v6.0.
Intel also co-developed results for the new end-to-end retrieval-augmented generation benchmark. A system combining a Xeon 6787P processor with four Arc Pro B70 GPUs divided the workload between the CPU and GPUs. The Xeon handles embedding, reranking, vector search and the small language model, while the GPUs manage large language model generation.
As demand for AI inference continues to grow, Intel is combining optimized hardware and software to deliver scalable, efficient and cost-effective solutions for increasingly complex AI workloads.
How Are Competitors Performing in the AI Space?
Intel faces competition from Qualcomm Incorporated QCOM and Advanced Micro Devices AMD. Qualcomm is expanding into AI data-center infrastructure through its Dragonfly platform, designed to improve the efficiency of large-scale inference workloads. The company introduced Hexagon NPU technology to deliver faster and more responsive on-device AI experiences. Qualcomm is developing Dragonwing processors that bring AI, vision and connectivity to a broader range of smart and industrial devices.
AMD is strengthening its AI infrastructure with the Helios platform, which integrates Instinct GPUs, EPYC CPUs and networking technologies for large-scale AI workloads. The platform is designed for large-scale AI inference, training and other demanding workloads. AMD continues to enhance its ROCm software to help developers build and run AI applications more efficiently.
INTC’s Price Performance, Valuation & Estimates
Shares of Intel have skyrocketed 230.6% over the past year compared with the industry’s growth of 27.1%.
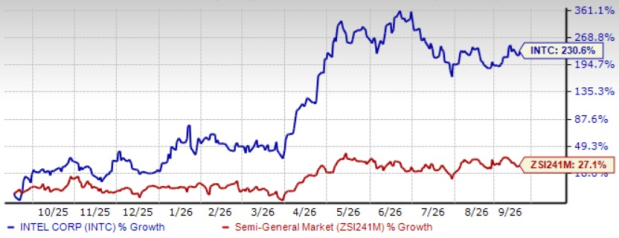
Image Source: Zacks Investment Research
Going by the price/book ratio, the company's shares currently trade at 4.94 times book value, lower than the industry average of 22.26.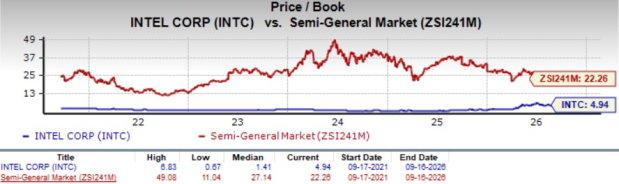
Image Source: Zacks Investment Research
INTC’s earnings estimates for 2026 have increased 44.2% to $1.50 per share, while those for 2027 have increased 30.7% to $1.96 over the past 60 days.
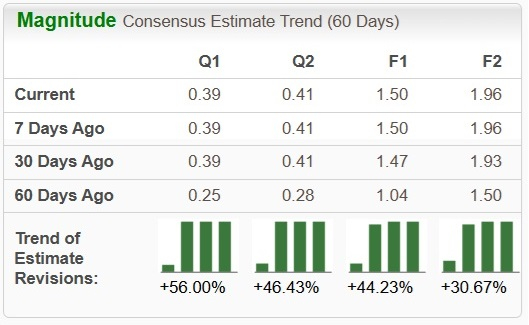
Image Source: Zacks Investment Research
Intel currently carries a Zacks Rank #3 (Hold). You can see the complete list of today’s Zacks #1 Rank (Strong Buy) stocks here.
Beyond Nvidia: AI's Second Wave Is Here
The AI revolution has already minted millionaires. But the stocks everyone knows about aren't likely to keep delivering the biggest profits. AI’s second wave is moving from infrastructure to implementation and these companies are at the forefront of this transition, positioned to become what Amazon and Google were to the internet era.
See Stocks Now >>This article originally published on Zacks Investment Research (zacks.com).
CONTACT US
100 West Lawrence Street
Suite 418
Appleton, WI 54911

HELPFUL LINKS
F.A.Q.
Privacy Policy
Terms of Use
Collar Capital Management, LLC is a registered investment adviser that offers advisory services to clients or prospective clients where Collar Capital Management, LLC and its representatives are properly licensed or exempted. This website is solely for informational purposes.